


Yes. You can assess marketing ROI across online and offline channels, but one headline figure rarely answers every business question. A useful diagnosis connects performance to the decisions leaders need to make: where to focus, what to change, and which outcomes merit continued attention.
It’s understandable to expect campaign dashboards to settle budget discussions, especially when teams are accountable for growth. But disagreements often reflect different priorities: marketing may track engagement, sales may focus on qualified opportunities, and finance may look at realized revenue. The answer is not simply another metric. It’s a shared view of progress and how evidence should guide action.
This article offers a practical way to examine channel performance without reducing marketing’s contribution to one number. You’ll learn how to assess online and offline activity, make budget choices with better context, test whether campaigns add value, and account for outcomes that take time to affect the business. The goal is clearer decisions, stronger team alignment, and a more grounded way of diagnosing marketing ROI problems.
Key Takeaways
- Combine channel data with sales and CRM outcomes to see how online and offline activity contributes across the customer journey.
- Compare marketing results by channel and protect room in the budget to test new opportunities before reallocating spend.
- Use incrementality tests to distinguish sales marketing created from sales that might have happened anyway.
- Set measurement expectations around sales-cycle length and make the assumptions behind ROI clear to decision-makers.
- Pair financial measures with signals such as brand perception, customer satisfaction, and loyalty for a fuller view of marketing impact.
1. Can I measure ROI across every marketing channel, including offline?
Yes, but no single platform captures every contribution equally well. Connect campaign activity to revenue, sales stages, and customer records, then account for channels that don’t produce an immediate click. This gives teams a shared view of performance instead of treating any channel report as the whole story.
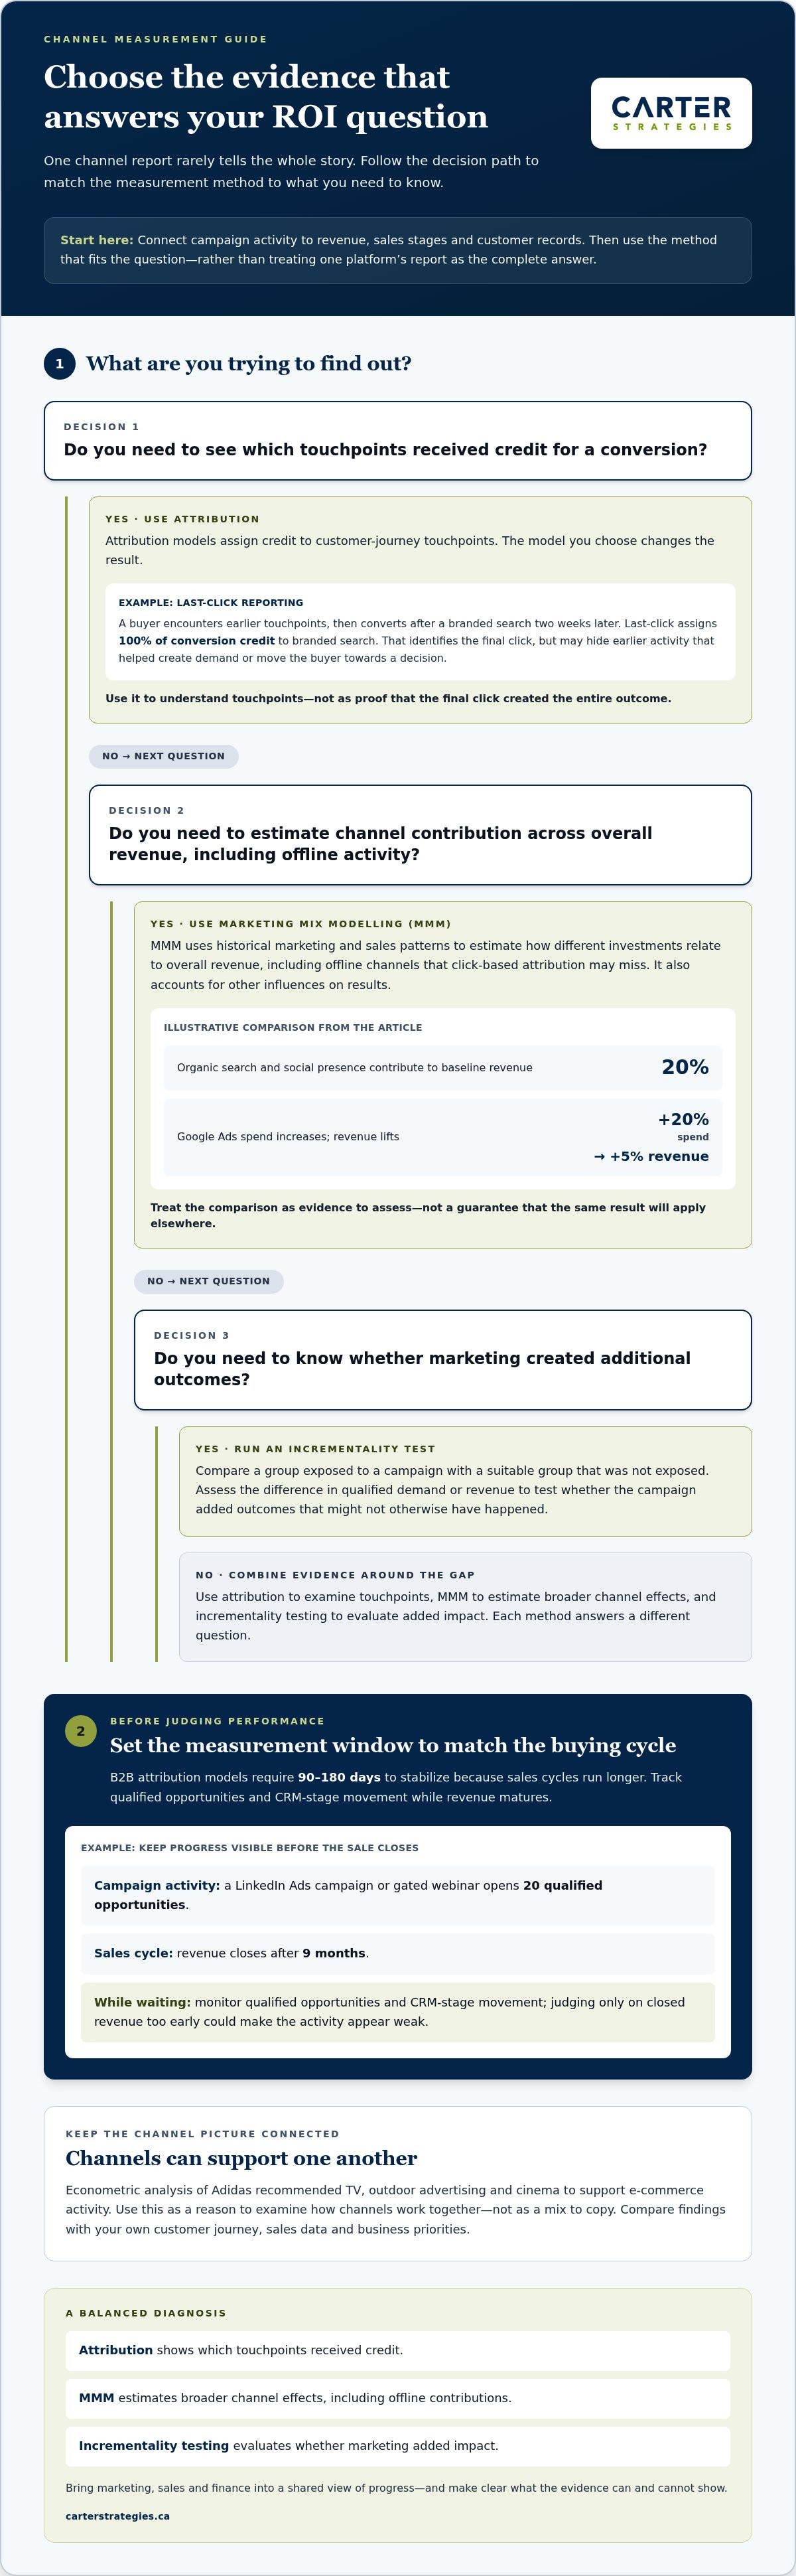
Attribution models assign credit to touchpoints in a customer journey, but the chosen model changes the figure. In a multi-touch example, a buyer encounters several earlier touchpoints, then converts after a branded search two weeks later. Last-click reporting assigns 100% of conversion credit to branded search. That record is accurate about the final click, but it can hide earlier activity that helped create demand or move the buyer toward a decision.
Set the measurement window to match the buying cycle before judging a campaign. B2B attribution models require 90-180 days to stabilize because sales cycles run longer. In one example, a LinkedIn Ads campaign or gated webinar opens 20 qualified opportunities before a 9-month sales cycle closes. Counting only closed revenue too early could make that activity look weak. Track qualified opportunities and CRM-stage movement while waiting for revenue to mature.
Marketing mix modelling (MMM) helps assess how different investments relate to overall revenue, including offline channels that click-based attribution may miss. It uses historical marketing and sales patterns to estimate each channel’s contribution, while accounting for other influences on results. In one example, organic search and social presence contribute a steady 20% of baseline revenue, while a 20% increase in Google Ads spend lifts revenue by 5%. The comparison helps test whether added spending is earning its place.
Econometric analysis can reveal contributions that last-click models undervalue. Adidas’s analysis recommended investment in TV, outdoor advertising, and cinema to support e-commerce activity. Treat this as a reason to examine how channels work together, not as a mix to copy. Compare the findings with your own customer journey, sales data, and business priorities.
Use incrementality testing to determine whether marketing generated additional outcomes, rather than receiving credit for conversions that would have happened anyway. Compare a group exposed to a campaign with a suitable group that wasn’t, then assess the difference in qualified demand or revenue. Combining this evidence with attribution and MMM gives a more balanced diagnosis: attribution shows touchpoints, MMM estimates broader channel effects, and incrementality testing evaluates added impact. Together, these approaches help identify which channels contribute to revenue and where measurement needs attention.
2. Data-driven budget allocation and optimization
Build budget decisions around comparable outcomes, not channel dashboards in isolation. Start with campaign revenue per dollar spent by marketing channel over the previous 90 days. Then compare that result with lead quality, sales-stage progress, and the time required to close. A channel with lower immediate revenue may still contribute qualified opportunities further down the funnel. Agree on these measures with marketing, sales, and finance before shifting spend, so each team understands what the comparison can and cannot show.
Point-of-sale (POS) and internal store data add context to retail campaigns, but they don’t explain every influence on a purchase. A store may record a sale without showing whether the customer first saw an online ad, promotion, or outdoor advertising. Where possible, match campaign timing and location with store sales, then compare trends across similar periods and locations. Treat the findings as evidence of a relationship, not proof that one campaign caused every sale. Store records also need consistent product, location, and date fields for meaningful comparisons.
Fragmented tools make that comparison harder. The average marketing team runs 19 point-solution tools across its marketing stack, leaving campaign, website, CRM, and sales records in separate systems. Create a shared reporting structure with consistent campaign names, channel definitions, and lead stages. Assign an owner to resolve duplicate records and missing source information. When one campaign appears under different names in Google analytics and CRM records, consolidate the labels before comparing performance. Otherwise, a reporting gap can look like a weak result.
Privacy changes since 2018 have made some marketing performance data harder to track. Build a privacy-first foundation by collecting only information needed for defined business purposes, controlling access, and documenting how records connect. Don’t treat a missing cross-device identifier as proof that a customer encountered only one channel. A person may see a campaign on a phone, then visit a website on a laptop and speak with sales by phone. Use consented first-party records and CRM stages to connect observable activity, while reporting gaps transparently.
Reserve 5-10% of the total budget to test new channels, then set a clear question for each test. For example, assess whether a new channel brings qualified leads from a segment that existing campaigns aren’t reaching. Record the audience, period, outcome, and decision rule before launch. Review results alongside the previous 90-day channel comparison, rather than moving budget after a single strong or weak week. This keeps experimentation purposeful while protecting the activities that already support revenue.
These decisions belong within a clear marketing strategy, where channel choices connect to business priorities and team ownership. A practical review brings the people responsible for campaign data, sales follow-up, and store results into the same discussion. They can distinguish a tracking gap from a genuine performance problem, then agree on what evidence should guide the next budget decision.
3. Incrementality testing
Design an incrementality test around one decision, such as whether to continue a discount-led paid social campaign. Before launch, define the audience, offer, measurement period, and outcome that would change your decision. Keep these conditions stable throughout the test. If the offer or audience changes mid-test, you won’t know whether the result reflects the campaign or the change.
Choose metrics that reflect the business goal, not just the advertising platform’s report. For new customer growth, track first-time purchases and subsequent repeat activity. For qualified demand, agree with sales on what qualifies and follow leads through the relevant CRM stages. Record these definitions before the campaign begins so marketing and sales assess the same outcomes.
ROAS measures revenue attributed to advertising relative to advertising spend. It can help monitor campaigns, but it doesn’t establish that a campaign generated additional revenue. Incremental revenue is the added result associated with a campaign after accounting for what likely would have happened otherwise. Read these measures together: a campaign may show strong ROAS but contribute little new demand, or deliver a more modest immediate return while attracting valuable customers.
Customer lifetime value can reshape that assessment. In the example, customers from an email or loyalty campaign spend C$600 over two years, while one-time buyers from a discount-driven paid social ad average C$150. Comparing only the first transaction would miss the difference in later value. Use the same observation period for both customer groups, and separate actual repeat purchases from projections. That gives decision-makers a clearer basis for judging whether a campaign attracts durable customer relationships.
Plan the analysis around operational realities. Confirm that the team can identify campaign exposure, connect customer records, and distinguish first-time from returning buyers. Check that sales follow-up and offer availability stay consistent during the test. If a major promotion or pricing change overlaps the campaign, record it as context rather than attributing its effect to advertising. These controls make the analysis more useful for optimization.
After the test, document the result, limitations, and next decision in a shared record. Marketing can explain campaign choices, sales can validate lead quality, and finance can confirm how revenue is counted. If the evidence supports a change, apply it to the next campaign and keep the measurement definitions consistent. If the result is unclear, refine the test question instead of treating an inconclusive finding as proof of success or failure.
4. So what challenges need to be overcome to prove marketing ROI?
Cutting marketing spend based on short-term ROI can remove activity that supports future demand, brand awareness, or longer sales cycles. It may also shift budget toward channels that capture existing demand rather than create new outcomes. Before reducing spend, compare the reporting window, attribution model, customer journey, and sales-stage evidence.
Board-level scrutiny is increasing: marketing leaders reported that board pressure rose 21% between 2023 and 2025. Reported pressure from the CFO increased 52%, while pressure from the CEO increased 20% over that period. These figures make a clear answer essential. Present the decision, evidence, and assumptions together, and distinguish measured revenue from pipeline activity or longer-term brand effects.
Budget constraints can also conflict with agreed strategy. In 2025, 59% of CMOs reported insufficient budget to execute their strategy. An outdated annual plan may lock channel allocations before customer needs or performance trends shift. Review the plan with marketing, sales, and finance, then connect each channel’s role to the outcomes it is expected to support. This creates a basis for reallocating funds without treating every short-term fluctuation as a reason to cut.
Inconsistent KPIs weaken a report before leaders even discuss the results. Marketing may count leads, sales may count qualified opportunities, and finance may focus on recognized revenue. Agree on shared definitions, data owners, and reporting periods before comparing campaigns. For example, count a lead as qualified only when it meets criteria agreed by sales and marketing. Then show how that lead progresses through the funnel.
ROI ratios can distort budget allocation when leaders compare different uses of a budget that isn’t fixed. A high ratio may encourage increased spending, even if additional investment delivers a lower return at the margin. Assess both the ratio and the expected business outcome of the next allocation. Compare channels by their contribution to revenue, pipeline, and strategic priorities, not by one figure alone.
Budget pacing helps teams spot overspending before it becomes a quarter-end surprise. Set planned allocations by channel, assign someone to review actual spending against the plan, and record changes with their reasons and expected outcomes. If a campaign is spending faster than planned, check delivery, lead quality, and sales follow-up before shifting funds. This helps distinguish a performance problem from timing or execution issues.
Make the board report a decision tool, not a collection of disconnected charts. Show the reporting period, KPI definitions, attribution model, channel allocation, and the action each result supports. Include what changed, what the team learned, and where evidence is still directional. Consistent measures and shared ownership help leaders scrutinize spending while keeping strategy tied to business outcomes.
5. Measuring intangible marketing outcomes
ROI, ROAS, and ROMI answer different questions about marketing investment. ROI compares net return with investment, while ROAS compares advertising revenue with advertising spend. ROMI focuses on the return associated with marketing investment. None captures every campaign effect on brand awareness, customer satisfaction, or long-term loyalty. Use financial measures alongside defined indicators of customer and brand outcomes, rather than treating one figure as a complete account.
Seasonality, sales cycles, and offline conversions can shift when results appear and where they are recorded. A seasonal campaign may influence demand before its sales peak, while a long B2B buying cycle can delay revenue after initial contact. Offline purchases may not appear in digital analytics, so connect available campaign records with CRM stages and sales data.
GA4 can report website traffic and online activity, but it doesn’t by itself connect every campaign to CRM-stage revenue or non-digital spending. Build a measurement view that combines campaign records, CRM outcomes, and offline activity. For example, connect a trade-show lead’s first recorded interaction to later opportunity stages and closed revenue. Define consistent source labels so teams can follow the journey without assuming every conversion came from the last digital touchpoint.
Choose indicators that describe the outcome you want to understand. Surveys can assess awareness or customer perceptions, while customer feedback can surface satisfaction and experience issues. Social-media sentiment analysis can help track how people describe a brand over time. Compare these signals with business outcomes, such as repeat purchases or qualified pipeline. A social media post with 10,000 likes may attract attention, but likes alone don’t show whether it contributed to sales or changed customer perceptions.
To make intangible outcomes useful, set a baseline before a campaign and repeat the same measurement afterward. Keep survey wording and audience definitions consistent, then review changes alongside traffic, CRM stages, and sales trends. Record the campaign period and other major activity that may have influenced the results. This won’t assign exact revenue to every brand effect, but it gives teams a clearer basis for interpreting changes and making decisions.
Use tools to bring evidence together, not to replace clear definitions. A CRM can show lead progression, analytics platforms can capture digital interactions, and surveys can collect customer feedback. Agree on shared reporting terms across marketing, sales, and finance. Then document which outcomes are tracked directly and which indicate longer-term impact. This helps decision-makers distinguish measurable activity from business value.
Aligning these measures with business priorities takes a shared approach to strategy and execution. Strengthen your marketing measurement strategy by connecting customer signals, campaign activity, and the outcomes your team needs to assess.
Carter Strategies: Business Strategy Development
Carter Strategies helps leadership teams connect marketing measures to business priorities through Business Strategy Development and Marketing Strategy. Turn to this work when channel reports don’t show which investments support growth, or when marketing and sales need shared outcomes to guide decisions.
Fractional CMO and CRO services provide senior marketing and revenue leadership for planning and prioritization. Growth Strategies and Planning can help turn findings into focused priorities and action plans, with employee involvement supporting alignment and ownership.
If your measurement challenges point to a broader strategy question, visit Carter Strategies to explore a practical next step.
Turn measurement into a shared plan
A disciplined approach to diagnosing marketing ROI problems can do more than explain past performance. It can help your team decide what to learn next, where to focus, and how marketing choices support the company’s direction. Bring the people who shape marketing, sales, and financial decisions into the same conversation.
Start with the business question that matters most. Clarify what evidence would support a decision, who needs to contribute, and how the team will act on what it learns. This keeps measurement connected to priorities and gives employees a role in turning analysis into progress.
When your team needs to align marketing choices with broader business priorities, Carter Strategies can help through Business Strategy Development, Marketing Strategy, and Fractional CMO and CRO services. Discuss ROI with Carter Strategies and identify a practical next step for your organization.
Clear priorities and shared ownership give your team a stronger foundation for moving forward.
Frequently Asked Questions
Can I measure ROI across every marketing channel, including offline?
Yes, if you connect channel activity to business outcomes through consistent records. Give each campaign a clear name, record its audience and timing, then connect those details with sales or customer records where possible. For example, sales staff can ask new customers how they heard about the business and record the answer in the CRM. This adds context for offline channels that don’t generate trackable clicks.
How do I prove ROI when leadership doubts the marketing budget?
Show how marketing investment supports a specific business priority, then connect the evidence to a decision. A useful report distinguishes confirmed revenue from leads, opportunities, and indicators of future demand. Include the assumptions behind the analysis, such as how the team defines a qualified lead. Have sales and finance review those definitions with marketing. Shared measures make it easier to discuss what the budget supports and what the team should adjust.
How do I track ROI across multiple locations or business units?
Use the same reporting definitions across locations while preserving each unit’s distinct results. Standardize campaign names, customer source fields, revenue categories, and sales stages, then add location or business-unit labels. For example, a national campaign can be reported centrally while local teams record store-level responses under a shared campaign name. Compare similar units and periods, and investigate differences in audience, promotion, or follow-up before drawing conclusions.
How fast can ROI actually improve?
The timeline depends on what needs to change and how quickly the outcome appears. Fixing inconsistent campaign labels can improve reporting sooner than changing customer behaviour or closing longer-cycle sales. Set a review point that matches the outcome: early checks can assess delivery and lead quality, while later reviews can assess revenue and repeat purchases. Define what evidence will trigger action before changing a campaign, so short-term variation doesn’t lead to premature decisions.
How is traditional (offline) advertising ROI tracked?
Connect offline activity to observable responses and sales records. A campaign can use a distinct phone number, response code, landing page, or offer identifier, then compare recorded responses and purchases with the campaign period. For broader activity, compare results across locations or audiences exposed to different levels of advertising. Ask sales staff to record how customers heard about the business, and use self-reported answers as one signal alongside transaction data.
So what challenges need to be overcome to prove marketing ROI?
The main barriers are inconsistent definitions, incomplete customer journeys, delayed sales, and channel reports that don’t align. Diagnosing marketing ROI problems means identifying which gap affects the decision at hand. For example, if sales records don’t show lead source, agree on a shared field and make it part of the handoff. If revenue arrives later, report leading indicators separately instead of treating them as closed sales.
What is marketing ROI, and why does it matter?
Marketing ROI compares the return associated with marketing activity against the investment made to produce it. It matters because it helps leaders assess whether marketing supports business goals and informs future resource decisions. ROI isn’t a complete score for every outcome: customer trust or brand awareness may influence future demand without producing immediate revenue. Use it alongside measures of customer response, sales progress, and longer-term business priorities.
How is marketing ROI calculated, and what costs and revenue should be included?
Calculate marketing ROI by subtracting campaign cost from revenue, then dividing the result by campaign cost. Define the measurement period and include revenue reasonably connected to the campaign. Include relevant campaign investment, such as media and production, using consistent accounting rules. Keep attributed revenue separate from revenue shown to be incremental. For example, report tracked sales and estimated added sales as distinct figures, rather than presenting both as equally certain.


